- About Us
-
Services
-

Lead Management Solution
Auto Capturing, nurturing, and converting potential customer leads.
-

AMC/ Warranty Management
Manage AMC contracts, track service requests, ensure timely renewals.
-

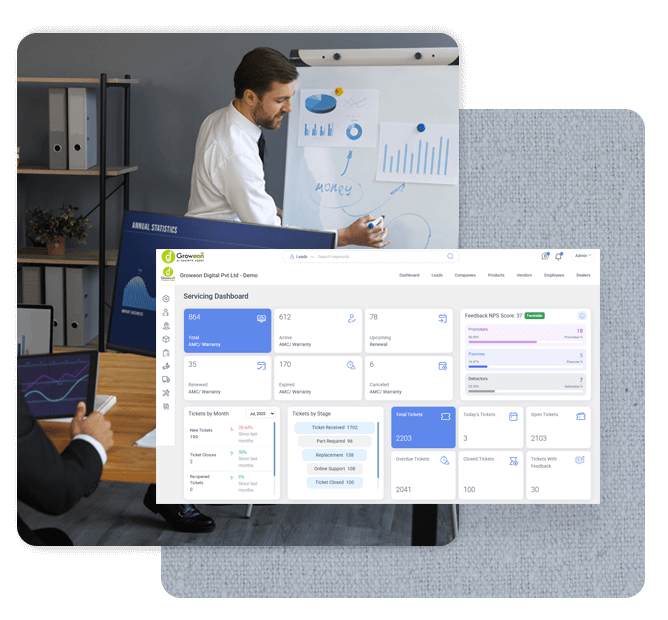
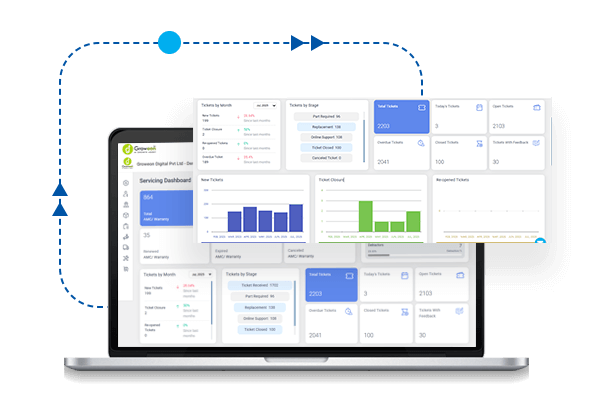
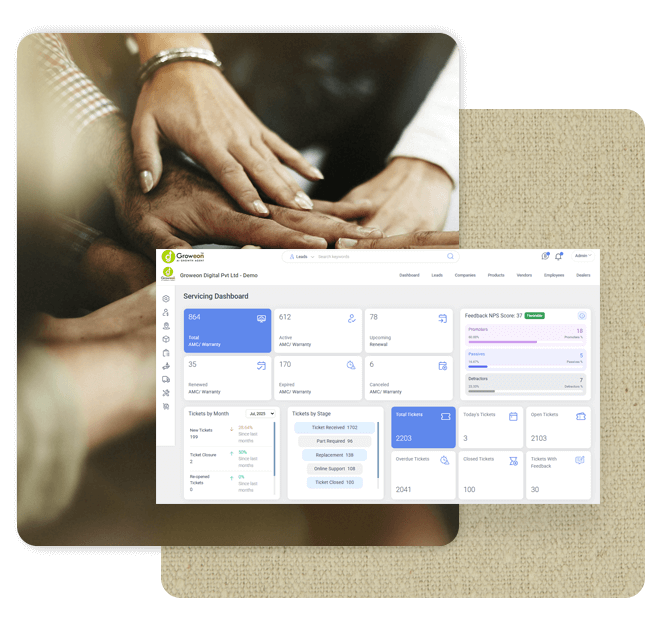
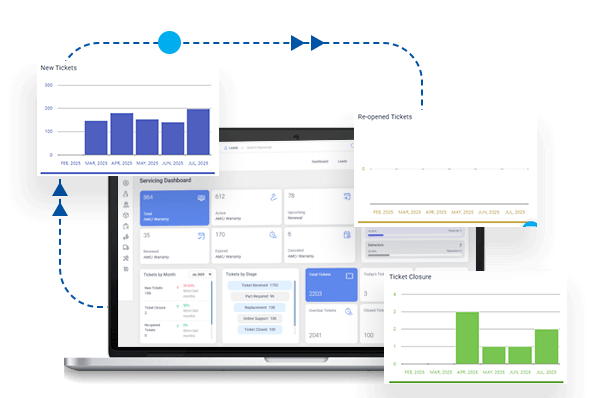
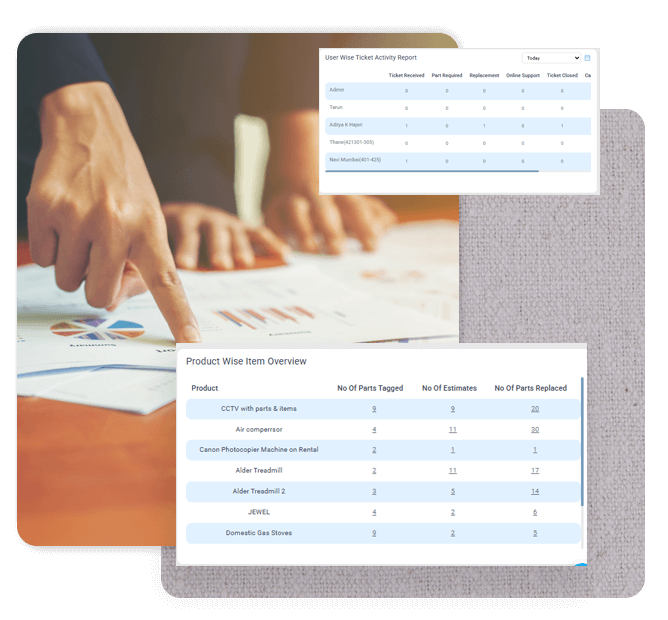
Service Ticket management
Tracks, resolves, manages issues, and gathers customer feedback.
-

Purchase Management
Manage purchases, expenses, vendors, and POs efficiently with CRM.
-

Order management solution
Manages order lifecycle from placement to delivery completion.
-

Invoicing Management
Generates invoices and manages sales transactions and records efficiently.
-

Inventory Management
Manages stock levels, tracks items, ensures efficient inventory control.
-

Dealer Management
Manages dealer workflows, assigns leads, and tracks progress centrally.
-

WhatsApp Business API
WhatsApp CRM integration with bulk messaging, auto notifications, chatbots.
-

IVR Solution
IVR enabled CRM integrates click-to-call, bulk dialling, recording features.
-

Bulk Dialer
Achieves optimum productivity of tele-sales team with auto dialler.
-
- Pricing
- Compliance
- News & Events
- API Integration
- CRM Software
- Industries
- News & Events
- Security
- Blogs
-